Understanding clinical test results
Pharmacy Magazine,
19 Jan 2021![]() 3 Min
3 Min
Pharmacy Magazine,
19 Jan 2021![]() 3 Min
3 Min
Pharmacy Magazine,
19 Jan 2021![]() 3 Min
3 Min
Measurements on a scale are often made to aid the diagnosis of disease or assess health states. Examples include blood pressure, prostate-specific antigen (PSA), human chorionic gonadotropin (HCG) and alcohol.
Sometimes ‘cut-offs’ are agreed on the scale so that a binary measure is possible, for example: pregnant/not pregnant, depending on the level of HCG; or under/over the blood alcohol limit for legal driving.

Accurate and reliable scale measurements can be very difficult to determine. In the case of Covid-19, we may seek to assess ‘antigen’ (the presence of viral particles) or ‘antibody’ (evidence of the body’s immune response to infection), both of which may vary over a wide range.
The ideal clinical test is cheap, accurate and reliable. Often tests are expensive and error-prone with performance varying in use. The overall level of uncertainty depends on the quality of the assay. A ‘gold standard’ (or diagnostic) assay is usually conducted in a laboratory, carefully validated and consistently calibrated. This ensures that different labs obtain the same results with similar samples.
A ‘screening test’ (often at the point of care) is useful to determine which cases justify further investigation but is inherently less accurate.
There is no absolute gold standard for Covid-19 testing, which would require serology (blood testing) and comprehensive clinical assessment. The operational gold standard is the RT-PCR test,1 which detects and amplifies viral nucleic acid (in the laboratory) from swabs of bodily fluid (carefully taken in the field).
Screening tests are characterised by their sensitivity and specificity in comparison to a gold standard.2
The key question here is: does the test accurately classify clinical cases and the healthy?
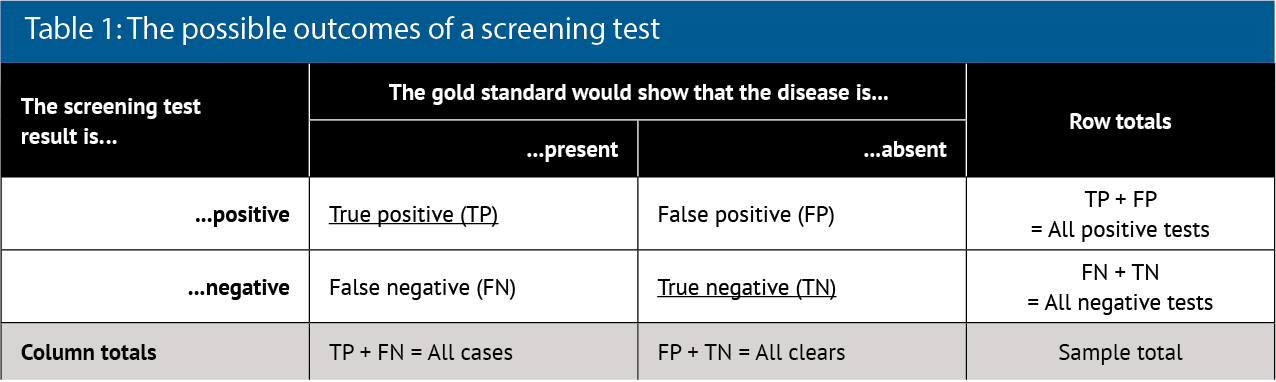
To show these characteristics, a 2x2 box (contingency table) is often drawn (see Table 1).
Analysis of the column data in Table 1 allows the test characteristics to be calculated:
These values can be expressed as proportions (zero to one) or percentages (0 to 100 per cent). Proportions make the calculations easier to perform, whereas percentages may be more readily understood. For example, if sensitivity is 90 per cent, then the test will pick up nine in 10 ‘real’ cases. If the specificity is 90 per cent, then one in 10 ‘real’ clears will be declared a case.
Sensitivity and specificity are the characteristics of the test derived from validation and usually considered to be fixed values. However, in day-to-day practice, the ‘real’ state of the world is unknown and test performance may vary. The reported (data sheet) sensitivity and specificity are, therefore, unhelpful guides for clinical decision-making.
The World Health Organization (WHO) recommends minimum standards of 80 per cent sensitivity and 97 per cent specificity for rapid Covid-19 testing.3
The key question here is: is the test result accurate?
Analysis of the row data in Table 1 allows the predictive value of the test to be calculated:
If PPV is 90 per cent, then nine in 10 positive results are true. If NPV is 90 per cent, then nine in 10 negative results are true. This is much more useful in practice because we know the screening test result, which is the denominator in PPV and NPV calculations. There are also two ‘rules of thumb’ linking sensitivity and specificity to the predictive values:4
Note that in Table 1 the prevalence of disease is given by:
Therefore, if sensitivity and specificity are fixed, then PPV and NPV are greatly influenced by the natural prevalence of the disease. Tables 2 and 3 illustrate this point.
Table 2 considers a sample of 100,000 people when the disease (e.g. Covid-19) prevalence is 1 per cent and a screening test meets minimum WHO standards. Note that a negative test result is almost certainly correct in these circumstances, but many false positives would be generated. The PPV changes little with sensitivity but increases as prevalence increases.
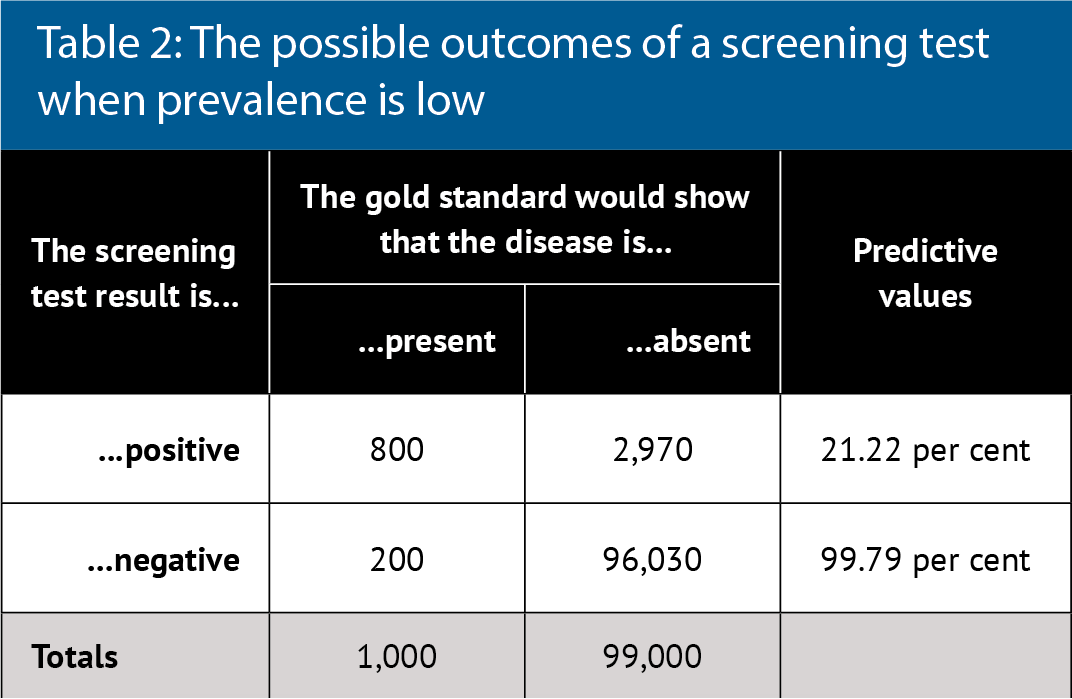
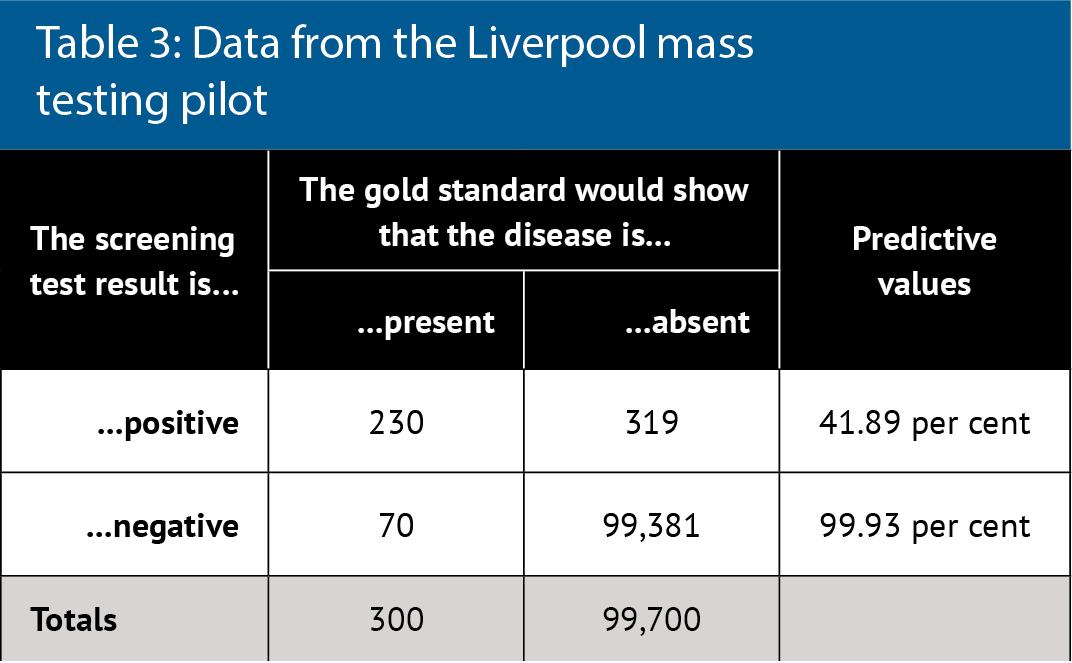
Table 3 considers real data about the Covid-19 lateral flow test, which is being used for mass testing.5 The reported test characteristics are 96 per cent sensitivity and 100 per cent specificity, few false negatives and no false positives, with near perfect predicative values even at low disease prevalence.
However, real world data and re-analysis of tests shows 76.8 per cent sensitivity and 99.68 per cent specificity. This data comes from the Liverpool mass testing pilot in which disease prevalence was 300 per 100,000 (0.3 per cent). PPV is 42 per cent overall but sensitivity also depended on who did the test: laboratory scientists were best (79 per cent) and self-testing was worse (58 per cent). Therefore, PPV actually ranged from 35 to 43 per cent. The greatest public health concern is not the inconvenience of a low PPV but rather the absolute number of false negatives, who can continue to spread disease.
Used correctly by experienced operators, many screening tests are highly sensitive and specific. Consequently, test results can largely be relied on when prevalence is high. When prevalence is low, however, PPV drops and there can be significant numbers of false positives even in ideal circumstances. Poorly validated tests and inexperienced operators will impact on both PPV and NPV.
When dealing with infectious disease, individual behaviours should be influenced by general guidelines not just personal test information.
The interpretation of test information can also be influenced by other information gained in the consultation. For example, with infection, the presence of symptoms or proven contacts with confirmed cases mean that a positive result is more likely to be correct. Whereas, if there were no symptoms and recent isolation, then a positive test result is more likely to be false. Repeated testing resolves many uncertainties.
1. Surkova E, Nikolayevskyy V, Drobniewski F. False-positive COVID-19 results: hidden problems and costs. The Lancet – Respiratory Medicine 2020; 8 (12): 1667-1168. doi.org/10.1016/S2213-2600(20)30453-7
2. Lalkhen AG, McCluskey A. Clinical tests: sensitivity and specificity. Continuing Education in Anaesthesia Critical Care & Pain 2008; 8 (6): 221-223. doi.org/10.1093/bjaceaccp/mkn041
3. European Centre for Disease Prevention and Control. Options for the use of rapid antigen tests for Covid-19 in the EU/EEA and the UK (Technical Report). ECDC, Stockholm, 2020
4. Baeyens JP, Serrien B, Goossens G, Clijsen R. Questioning the “SPIN and SNOUT” rule in clinical testing (2019). Archives of Physiotherapy 2019; 9, 4. doi.org/10.1186/s40945-019-0056-5
5. Bunn S. Mass testing for COVID-19 using lateral flow tests (Rapid Response). The Parliamentary Office of Science and Technology (POST), London, 2020.